
The following was provided by Dr. Willie Soon, reproduced with permission from Dr Ian Flanigan. The Coalition referenced in the post is the current Australian Government, a Coalition between the Liberal and National parties.
Core of climate science is in the real-world data
by Dr Ian Flanigan
News Weekly, November 18, 2017
The Government continues to flounder with directionless and inconsistent energy policies, inviting much public commentary, but the science these days scarcely gets a mention.
As we have seen in social policy, the strategy of the left is first to shut down debate and delegitimise any dissent from the position adopted by the left-leaning elements of the media, academia, bureaucracy, the environmental movement and renewable-energy interests.
Lacking the capacity to distinguish science from pseudo-science, the Coalition under Howard effectively acquiesced to the totalitarian-left idea that the science on global warming was settled. It dared not question the assertion that carbon dioxide was causing dangerous global warming for fear that it would be loudly denounced and ridiculed as being in denial about the harmful effects that our emissions of carbon dioxide were supposed to be having on the climate.
In doing so, the Coalition allowed the totalitarian left to define the terms of the debate. But, let us do the impermissible and look at the science behind the question of whether carbon dioxide is causing dangerous global warming.
The scientific method for investigating a new idea is to pose two falsifiable hypotheses: the null hypothesis and the alternative hypothesis. The null hypothesis tests the most obvious explanation; and the alternative hypothesis tests the new theory that the scientist is bringing to bear on the issue.
In the context of global warming, the null hypothesis is that the warming observed since the onset of industrialisation is due to natural causes; the alternative hypothesis is that this warming is due to anthropogenic carbon-dioxide emissions. Both hypotheses must be tested and the objective is to see which of these two hypotheses is incompatible with the data. That is, we are attempting to falsify one or the other or both of the hypotheses (since it is conceivable that there is another human-related cause of the global warming which has not yet been thought of).
A hypothesis can never be proved by this method but it remains viable only as long as it remains consistent with the data. You must not cherry-pick your data; the hypothesis must be consistent with all of the available data. It takes only one instance of the hypothesis being found to be inconsistent with the data for it to be falsified; and this is why the science is never “settled”.
One must begin by assembling all of the available data. The data we are concerned with in this issue are the temperature and atmospheric carbon-dioxide data. The temperature data consists of the meteorological record that has been collected using various instrumental techniques since the 1850s, and also data from various “proxy” sources that enable the temperature record to be inferred. This may be done from such techniques as the measurement of isotope ratios in gas samples extracted from ice cores and seabed cores.
Using these proxy sources of temperature data, scientists have been able to reconstruct the temperature history of the planet going back thousands to hundreds of thousands of years and beyond. Samples collected from ice and seabed cores can also be used to determine the concentrations of carbon dioxide present in the air over those periods.

on Climate Change at the Heartland Institute on June 12, 2015). Air Temperatures
above the Greenland ice cap for the past 10,000 years reconstructed from
ice cores using data from Alley, 2000 (The Younger Dryas cold interval
as viewed from central Greenland. Quaternary Science Reviews 19, 213-226)
(top panel), with a time scale showing years before modern time.
Lower panel shows the carbon-dioxide concentrations of the atmosphere
over the same period from EPICA Dome C ice core.
Figure 1 shows one example of data derived from such proxy sources. The top panel of the figure shows a declining temperature trend over the 8,000-year period from the Holocene Climate Optimum to the modern warm period (left-hand scale). It also shows that this location experienced numerous cycles of warming and cooling that involved temperature changes of the order of two degrees Celsius.
The superimposition of the temperature data from the modern period instrumental record (dotted line and right-hand scale) provide a very appro-ximate context to the late 20th-century warming.
The lower panel shows that the carbon-dioxide concentration over the same period has been consistently increasing. Neither the cooling trend nor the cyclic behaviour of temperature is reflected in the carbon-dioxide record in the lower panel. Therefore carbon dioxide cannot be causing the observed temperature changes. No causation can exist if there is no correlation.
These data clearly show that whatever effect carbon dioxide may have on the temperature, it is far outweighed by other factors: and this falsifies the hypothesis that carbon dioxide causes dangerous global warming. The data show that there is nothing unusual about the current episode of increased global temperature in either its timing or its amplitude, which lies well within the bounds of natural variation.
From these data we cannot ascribe any cause to the current warming event, nor is it necessary to do so. We simply observe that the data are seen to be consistent with the null hypothesis that the modern warming is due to natural causes, and inconsistent with the alternative hypothesis that this warming is due to carbon dioxide. We do not need to understand the details of the operation of the climate system, which so occupies the Intergovernmental Panel on Climate Change (IPCC).
It is important to recognise that no single data set is ideal. All available data sets have their limitations, including those of Figure 1. It is equally important to recognise that all of the available data must be considered. It is not valid to simply disregard data that don’t suit you when there is no satisfactory data set available to provide all the information required on its own.
The data most commonly relied upon in making the case that carbon dioxide is causing dangerous global warming are the data from the instrumental meteorological record. Over the 167-year period of the meteorological record, it is not possible to observe the extent of natural variation in temperature that can be seen in the proxy record of figure 1. Therefore the meteorological record is incapable of being used to test the null hypothesis. This makes the meteorological record the least useful of the data sets that are available for answering the question of whether the warming observed over the last 100 years is due to increased carbon dioxide in the atmosphere. Conclusions based on these data alone are therefore worthless.
The main limitation of the data of Figure 1 is that they are derived from ice cores at a single location and cannot therefore be considered to represent the “global average” temperature that the meteorological record attempts to approximate. This does not mean that these data can be disregarded. There is evidence from a vast range of sources that the warming cycles of Figure 1, among them the Mediaeval Warm Period, The Roman Warm Period, the Minoan Warm Period and the Holocene Climate Optimum, did not occur only at the sites from which the cores were taken but were in fact widespread and probably global. (For a comprehensive discussion of the evidence, see Heaven and Earth. Global Warming: The Missing Science, by Professor Ian Plimer. Available from Freedom Publishing.)
It is probable, however, that the amplitude of the temperature excursions from the baseline in Figure 1 are somewhat larger than would be seen in a global average graph, if such a graph were available, since temperature variations in equatorial regions are usually smaller than temperature variations at higher latitudes. Nevertheless, the data cannot be ignored, because such data provide the best indication we have of the natural variability of temperature and provide the context within which modern-day warming must be considered. In this context, the current warming event appears to be just the latest in a long series of warming and cooling cycles.
The alternative hypothesis is seen to be completely inconsistent with the data and must be rejected since the 8,000-year declining temperature trend occurs in conjunction with a steadily increasing carbon-dioxide trend.
The current meteorological record shows that there has been no statistically significant warming over the past 19 years. This suggests that we may be at the peak of the current warming cycle and that the next temperature change is more likely than not to be the cooling phase of this cycle. This is consistent with the expectation by some astrophysicists that in the next 20 to 30 years we will encounter conditions similar to those of the Little Ice Age that were experienced during the last cooling cycle.
Under those conditions, the global-warming alarmists may come to regret their love affair with wind turbines that stop turning and solar panels which, in colder areas such as those located around Canberra, may become covered with snow if the southern hemisphere experiences a similar cooling to the northern hemisphere. The alarmists may then want to burn all the coal that they can get their hands on. That may become difficult if the Greens are successful in their push to have all coalmines and coal-fired power stations closed down. Do they seriously imagine that these natural climatic cycles have somehow stopped?
Changes in the climate can be expected and it is prudent to prepare for them. But whether it is warming or cooling, our ability to cope with the changes will depend on the availability of cheap and reliable power. It is deadly foolish to base our response to inevitable climate changes upon a theoretical understanding of the way that the climate system operates that is known to be inconsistent with the data and that would result in a complete inability to deal with the cooling that will inevitably come at some time in the future.
The cooling that was experienced in Europe during the Little Ice Age resulted in shorter northern-hemisphere growing seasons, crop failures, starvation, depopulation and the plague, and was far more deadly than any possible warming we might face. (Again, see Plimer, Heaven and Earth.)
Although there is endless reporting and commentary about the danger of global warming, there is no mention of the data supporting the anthropogenic global-warming hypothesis because no such data exist. Discussion always diverts to such matters as modelling, sea-level changes, weather events, reef bleaching, melting ice caps or any of a myriad other phenomena in which changes have been observed.
If you study nature you will always observe change, but these changes must be seen in their proper context. All of these changing phenomena may (or may not) be signs of warming. But signs of warming are precisely what one would expect to see at the peak of a warming cycle and they tell us absolutely nothing about the cause of the warming. To test the hypothesis that it is carbon dioxide that is causing the warming we must turn to carbon dioxide and temperature data: and they show that whatever the cause of the warming is, it is not carbon dioxide, whose warming effect, such as it is, is clearly outweighed by natural factors.
Any attempt to imply that rises in sea level, for example, are a sign that carbon-dioxide emissions are the cause of global warming is bogus science (there are other reasons why sea levels might rise). It is effectively saying that the hypothesis that carbon dioxide is causing global warming is being supported by another hypothesis: that sea-level rises are due to global warming, which is due to carbon dioxide. Or that the bleaching of the Great Barrier Reef is due to the warming of the oceans, which is due to global warming, which is due to carbon dioxide.
You cannot support a hypothesis with another hypothesis or even a series of hypotheses. That is bogus science. The test of the global-warming hypothesis can only be made against the carbon-dioxide and temperature data.
In a similar vein, any attempt to assure us that we must cut emissions because if we add more carbon dioxide to the atmosphere we will reach a “tipping point” that our theory (and our models) show will bring us catastrophe, is also bogus science. Such a line of reasoning is effectively saying: “Don’t take any notice of the data that falsify our global-warming hypothesis. No, we have a theory about how the climate system operates and our understanding of this system is much better at telling how carbon dioxide affects the climate than the data. We know about triggers and tipping points and whatnot, and if we keep adding to the carbon dioxide it will bring catastrophe – just you wait and see.”
That is not science; you cannot support a hypothesis with a theory. The theory is, after all, based on the premise that the hypothesis is true: but the data show that it is false. When vascular plants evolved on earth some 400 million years ago, the carbon-dioxide concentration was more than 10 times the current level, and that did not cause tipping points or runaway global warming; yet we are asked to believe that a mere doubling of carbon dioxide from the very low levels we see at present will bring catastrophe.
Those who claim that carbon dioxide causes dangerous global warming need to produce data that force the rejection of the null hypothesis: that the warming is due to natural causes. This has not been done and, in the absence of those data, the global-warming hypothesis must be regarded as nothing but a theory based on a premise that is known to be false.
For all the costs that “clean” energy policies and high energy prices impose on household, business and national budgets, there can be no possible bene-fit, since the proposition that carbon dioxide causes dangerous global warming is falsified by the data.
One must ask: how can the government have got it so wrong, since the government has access to the best scientific advice available?
The answer to that has two parts. The first, as alluded to earlier, is that the left long ago completed its march through the institutions – including the scientific institutions – so the overwhelming majority of advice to the government conforms to the so-called “consensus” view. The second is that there are too few people entering the ranks of Parliament who understand science and who recognise when they are being fed pseudo-science by those providing the advice.
As the late Professor Bob Carter pointed out, it was not until the election to Parliament of Dr Dennis Jensen as a Liberal Member for the House of Representatives in 2004 that the Liberal Party had anyone with the scientific qualifications and training to discern the pseudo-science from the science and develop an informed approach to the global-warming issue. Dr Jensen displayed a healthy scepticism about the global-warming alarmism in his maiden speech to Parliament.
Unfortunately, Mr Howard did not put him in charge of global-warming policy. Instead, the Liberal Party continued to struggle with the issue while the myths and falsehoods associated with global warming took hold and green ideology took the moral high ground in professing to be intent on saving the planet from “carbon pollution” and the dangerous global warming it was alleged to cause.
Malcolm Turnbull entered Parliament in the same year as Dr Jensen and, in the biggest mistake of his career, Mr Howard in 2007 placed the left-leaning Turnbull in charge of Environment and Water Resources, presumably to give his environment policies some “green credentials”. The opportunity to tackle the global-warming falsehoods and develop a rational energy policy was thereby lost.
The election of Donald Trump to the presidency of the United States and his rejection of the Paris Climate Change Agreement, however, provide the Australian Government with an opportunity to admit its mistake and change direction on global warming and energy policy and thereby give itself a chance of snatching victory from the jaws of defeat at the next election. It needs to find a leader who can tackle this issue head on in the face of the furious opposition that it will encounter from the ABC and the rest of the media, academia, the bureaucracies, and vested interests in the scientific and renewable energy industries.
It will be a tough fight, but it is a fight that can only be fought from within government and not from opposition. It is only when you control the appointments and the purse strings that it is possible to challenge those presenting pseudo-science as evidence and dismiss those who will not properly deal with the scientific objections to the global-warming “consensus” position.
I believe it is the only way this nation can be saved from the high energy costs that are crippling our industries and punishing household budgets. Providing strong support to President Trump on this issue might even begin to turn around this insanity globally and allow the availability of cheap and reliable power to lift underdeveloped nations out of the poverty that currently denies them access to electricity, clean water and sanitation.
Dr Ian Flanigan (retired) obtained a PhD in chemistry at the Research School of Chemistry (ANU).
Original source: http://www.newsweekly.com.au/article.php?id=57887
Comment (Eric Worrall): My native Australia continues to suffer the effects of climate driven public policy madness. Despite dire warnings from heavy industry and an economically damaging slump in consumer spending, renewables continue to receive high level support from all levels of Australian government. Our hope is scientists like Dr. Ian Flanigan can reach enough people to turn the tide, before the Australian economy is completely wrecked by this political idiocy
I know we’ve had this discussion before at length…but just what year does the 0 time represent…is it 1900, 1950AD or what.
According to M. Mann, the start of the up-tick is 1900.
So it looks like the 0 is pretty much in the right place.
Graph doesn’t show the 1940’s peak and drop to 1970 though.
Needs correcting.
Today we have about 400ppm CO2 So where are the 400PPM ? Outside the graph?
BTW I always respect the the presentations of Willy Soon, because its exclusively based on science!
If I remember correctly, it takes 50 years for snow build up on a glacier to become a layer of ice. So 0 should represent 50 years prior to the ice core being drilled…
jc,
“The vast majority of proxy data confirms that CO2 is not a primary driver of global atmospheric temperature change, and that the temperature changes are the result of natural factors that are not yet understood.”
I don’t know why you’re not getting this, but – I agree. I’ll say it again – CO2 has not been a primary driver, at least in the Quaternary, because nothing has been driving it. So changes have been due to other things. This doesn’t contradict the AGW story, which is that if you do force the system, by injecting large amounts of CO2, it will cause warming. No-one has done that before.
Time for new snow to turn to firn then to ice depends on snowfall rate and is variable. Accumulation from heavy snowfall rates more rapidly build underlying pressure and decrease the time to form ice.
Hi Nick. How about this: The question is sensitivity is it not?
Why not construct a simple experiment (not a computer model). Example: Name of experiment “Sensitivity of CO2 under Controlled Atmosphere Condition”: Construct a well insulated 4” X 4” X 7” room on a large cargo plane. Inside the room you would need a bucket of water, inferred light, away to monitor air temperature, water surface temperature, concentration of CO2 and air moisture content. Outside the room in the cargo area you would need away to monitor air temperature, concentration of CO2 and air moisture content. Also needed: Air exchange system and away to inject CO2 into the room. Install inferred light in the center of the ceiling and place the bucket of water directly below the light on the floor. Let the plane sit on the tarmac with the light turn off for 24 hours then take record the readings: air temperature, concentration of CO2 and air moisture content both inside and out of the room. With the light off raise the room’s CO2 concentration to 600 ppm. After 24 hours record the readings again. Purge the room with outside air, turn the light on after 24 hours record readings. With the light on raise the room’s CO2 concentration to 600 ppm. After 24 hours record reading. I believe this would give you a base line to work with. Fly the plane to the top of the Troposphere and repeat monitoring steps. Variations: Remove bucket of water, add humidifier and dehumidifier to air exchange system, paint inside room walls different colors (white or black), increase concentration of CO2 and so on.
Nick Stokes
November 22, 2017 at 6:43 pm
———
Yes Nick, The point you make in this comment, as far as I can tell stands as valid in principle.
But then again what would you say, if the main approach of this blog post substance stands in the point of the nullification and falsification of AGW, in the prospect and dependency of paleo climate data?!
As far as I can tell, at this point in time, the only way to approach and consider a nullification and falsification of AGW, it is only probable and supported by the modern data alone…..no any need to pollute that approach by trying to invoke some more unnecessary adding, like the dependency in paleo climate data…not needed at all.
The question is why this attempt!
Maybe you have already actually clarified, or maybe not, some thing in this lines in the following threads and comments.
But for the sake of your understanding at this particular point, which I wholly agree with, let me ask for your opinion, if you could answer.
What actually do you think is or could be the real aim of such as an attempt as per the main approach of the subject and matter put forward in this blog post??
Thanks in advance.
cheers
Yes, it has been diYes, it has been discussed endlessly. BP means before 1950AD. And the GISP ice data has also been discussed endlessly. It ends in 1855. So it shows no modern warming. The continuation with red dots from global instrumantal as a farce. There is no basis for extending the plot of a highly variable single site on the ice cap of Greenland with a global average. And there is no basis for labelling the right axis as approximately global. Individual sites, anywhere, are far more variable than the global average.
And he claims to be talking abouyt real data!
scussed endlessly. BP means before 1950AD. And the ice data
Nick Stokes
November 22, 2017 at 4:43 pm
Thanks Nick…I sort of thought it might have been 1950.
Do you happen to have a better graph of temperatures covering the same period, or even better extending up to the (almost) present?
Alastair,
Sorry, I don’t have a plot of global temperature data for that period, although Marcott is close. Generally proxy data gets unreliable near present for various reasons; fortunately we have instrumental, but you have to match like with like.
When one looks at the observed and recorded data for Greenland, it is no warmer today than it was in around 1940 (save for a 1 year spike caused by the strong 2010 El Nino). Eg:
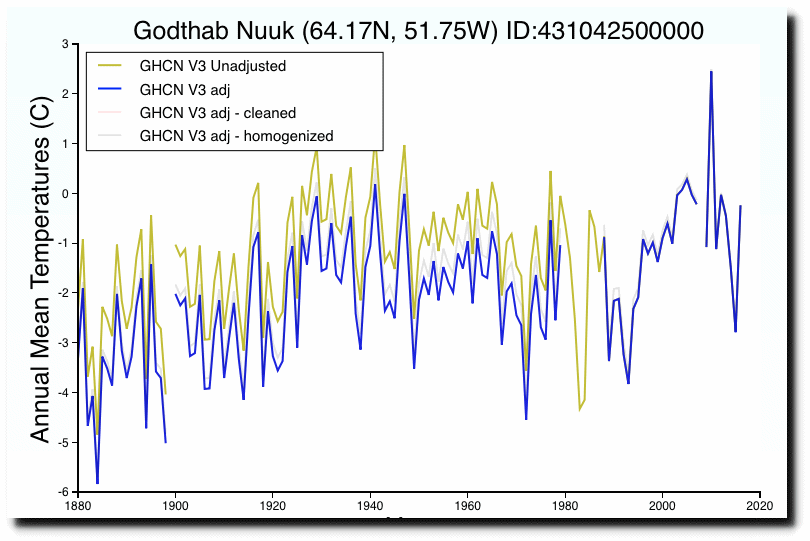
The very same trends can be seen in Iceland when one looks at the RAW data, Eg:
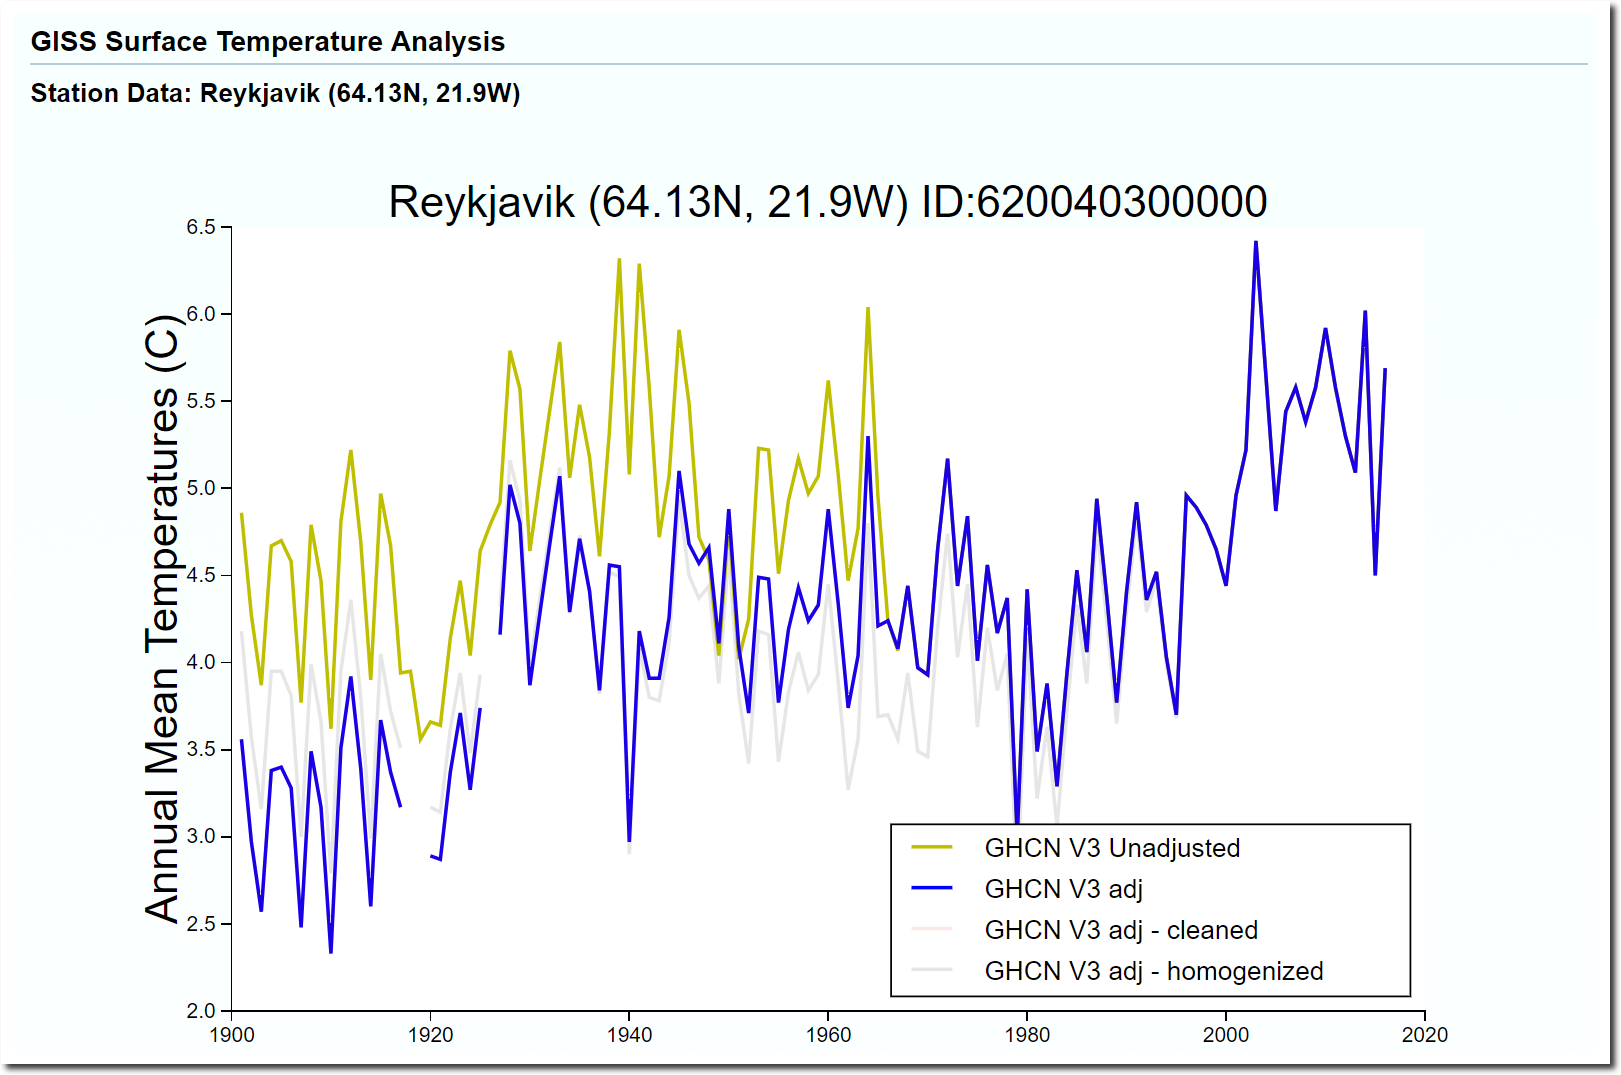
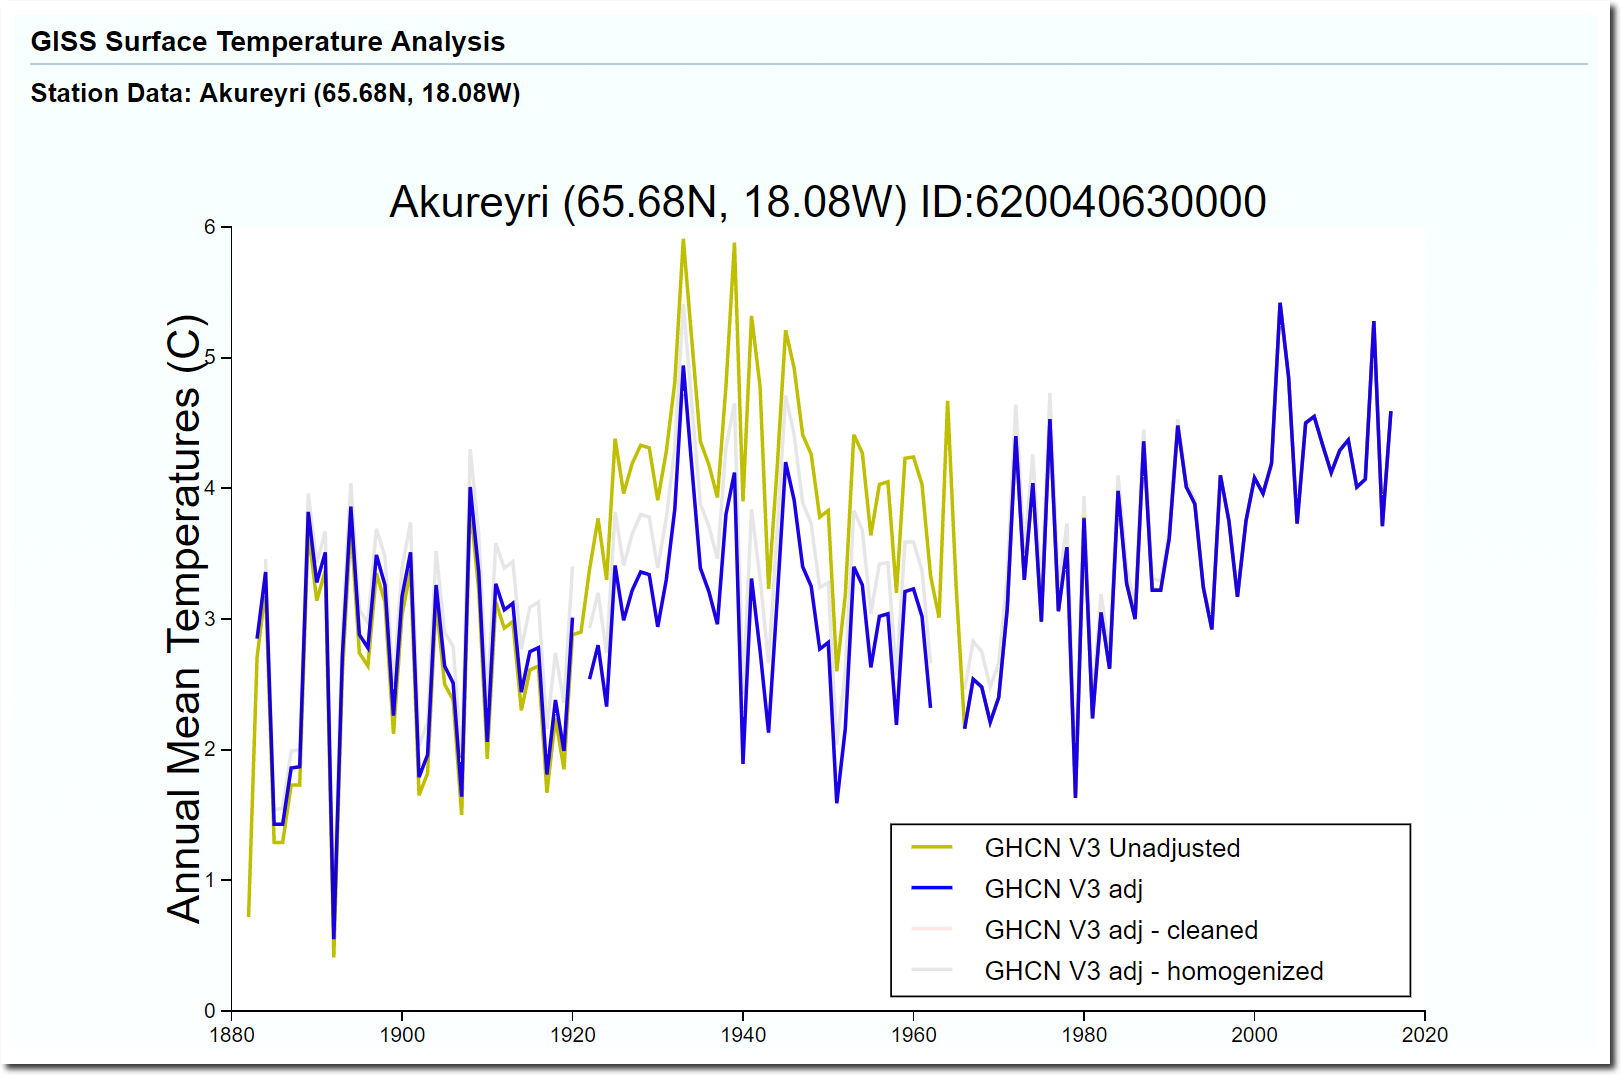
Data Source GISS (from their website)
Like so many places, the warming is the result of adjustments to the RAW data. Are those adjustments sound? That needs to be verified by retrofitting the stations with the same equipment as used in 1940 and observing using the same practices as used in the 1940s so that modern day observed RAW data can be directly compared with historic observed RAW data with no adjustments made to the recorded data. Just station by station, comparing each station with itself to get proper like for like comparisons.
Perhaps some history might be useful:
It is always interesting to remember what Schneider of GISS (and NCAR) thought. His 1971 paper had a very low sensitivity for CO2 (even with water vapour feedback), and of course he was full behind the global cooling scare that warmist would have one belief that no serious scientist was promoting. Wee perhaps Schneider is not a serious scientist.
richard, the funniest part is they have adjusted 100 years of temp data in some cases
No one will even convince me there’s a legitimate reason for that….making the past fit the present
Nick, the end of the graph is inconsequential to the argument being presented. The vast majority of proxy data confirms that CO2 is not a primary driver of global atmospheric temperature change, and that the temperature changes are the result of natural factors that are not yet understood.
But if you don’t like proxy data, then one can use the ‘Pause’ to essentially make the same argument, and falsify the CAGW theory.
From the beginning, the data has not supported the AGW hypothesis. It still doesn’t. The fact that it is still an issue is strictly political. Science must be ignored to support the political agenda, and that is precisely what is happening. Most believers are not educated, but those who are educated must be believers in the Precautionary Principle, saying: “Okay, the data doesn’t support it, but what if the theory is right anyway? Shouldn’t we do something, just in case?”
All of my discussion with AGW supporters for nearly 30 years now, have ended with my opponent invoking the Precautionary Principle, which is not a principle nor precautionary. It is an evil bit of propaganda that has a long and bloody history. It is a form of linear, static, egotistical thinking in a very non-linear, evolving, non-egotistical world. It is a recipe for disaster.
In summation, the only thing supporting a theory of a CAGW event, that has already been thoroughly falsified by science, is a proven recipe for disaster.
jclarke341 …damn good!
“invoking the Precautionary Principle,”
Is an indication that they have LOST THE SCIENTIFIC ARGUMENT !!
jc,
“The vast majority of proxy data confirms that CO2 is not a primary driver of global atmospheric temperature change, and that the temperature changes are the result of natural factors that are not yet understood.”
I don’t know why you’re not getting this, but – I agree. I’ll say it again – CO2 has not been a driver, at least in the Quaternary, because nothing has been driving it. So changes have been due to other things. This doesn’t contradict the AGW story, which is that if you do force the system, by injecting large amounts of CO2, it will cause warming. No-one has done that before.
I think you miss the point. Much has been made of the dangers of a 2 degree increase over the temperature at the start of the modern warm period. And yet the graph clearly show that the Minoan Warm Period reached a temperature 3 degrees higher. (-29 C, vs -32C). Since the world didn’t come to an end then, it won’t now.
We need some evidence-based policy, not belief-based policy.
Then again, Nick, Antarctic ice cores show essentially the same stuff as the Greenland cores. If both poles show similar variations, shouldn’t we be careful of jumping to CO2 conclusions?
I am not going to argue about wiggles in graphs of data. We are experiencing the cooling trend at the latter half of the Holocene.
Any warming from the Little Ice Age is welcome. Calculations of the Social Cost of Carbon (SCC) are bogus. Prove me wrong, Nick.
“And yet the graph clearly show that the Minoan Warm Period reached a temperature 3 degrees higher. (-29 C, vs -32C)”
It shows that that single site on top of the Greenland plateau was 3C higher.
As Nick says – you cannot extrapolate that to the entire planet.
Also:
There was something different back then to now – the Sun’s obliquity was greater – leading to more Summer insolation at 65 deg N.
http://68.media.tumblr.com/28974d49429ae9a8b92bd60c1c69b1ed/tumblr_omviowAc481t4esr2o1_1280.jpg
I make that about 10 W/m2 greater solar forcing than now.
Current anthro forcing since pre-industrial stands at ~ 2 W/m2.
So 5x more then.
“if you do force the system, by injecting large amounts of CO2, it will cause warming. No-one has done that before.”
It may or may not cause warming….obviously there are bigger things in play….because it has or has not caused warming in the past
NS and others, there is s simple way to falsify the AGW hypothesis. Indisputably, Mauna Loa’s Keeling curve shows CO2 concentration risingmonotonically since 1957. Yet from to ~1975 there was no rise in GAST. Further, about 35% of the total CO2 increase occured this century (since 2000). Yet except for the now cooled 2015-2016 El Nino blip, there has been no increase in GAST this century (the pause). Both periods show that natural variation predominates over any GHE from CO2.
ristvan November 23, 2017 at 9:45 am
“show that natural variation predominates over any GHE from CO2.”
So you are saying that variations caused by CO2 concentration at least remain insignificant and continue to act in the same way as all the other “natural variations” always have? And so how can you ascribe a single cause to the overall rising, century- long trend?
Variation caused by CO2 concentration has changed. The rate of change is similar to past abrupt changes.
Much further, much faster change is baked in. There is a lag for the maximum affect to be felt – in the order of decades to centuries depending on the size of the emmission (Zickfeld and Herrington, 2015). In 1000 years, 20% of that pulse has yet to be absorbed…if emissions stopped yesterday (Frölicher, Winton & Sarmiento, 2014)
And you’re asking me to just cross my fingers and hope this baby doesn’t go off???
When the vast preponderance of the literature says you are wrong?
Are you ready for some abrupt changes?
TM, nope. You show some, then I will reconsider. Your comeback, BTW, did not at all adress my criticism of your view. Perhaps you could factually Adresse that issue specifically?. Thought not.
Both periods show that natural variation predominates over any GHE from CO2.
That maybe so… for those periods where the trend is less pronounces. Despite that the overall trend is up.
By your own logic doesn’t that imply there must be other periods that GHG variations predominate, and even more so? Some thing(s) forcing it warmer has predominated overall.
@ur momisugly Nick Stokes
OH GOOD GRIEF, …….. I guess being “learning disabled” is still better than being totally illiterate.
I guess any papers written before 1950 were not permitted to use the BP reference, right?
And any papers written after 1950 couldn’t state a BP reference either, right?
Sounds like Australia needs to do what was done here in the US: elect the right people into office that will change the policies and legislation that is in the process of wrecking your country. I think we here in the States narrowly missed a big green bullet by getting Trump elected instead of Hillary, and Trump has proceeded to dismantle Obama’s green legacy.
Having witnessed changes in education over the last 30 years in science
education (I taught science for 28 years) I know that Australia always follows
“new ideas and trends ” that originate from our colonial masters in the UK.Very
recent trends have emphasized more arts based approach with grammar analysis
and some added political correctness.To me I find Australia is a land of “followers”
who have always wanted appear to be doing the right thing.It was reflected in exactly
what John Howard did with green ideology he also legislated the disastrous RET that
has increased energy costs to households and businesses to the point where an economic slump or recession is likely to be a very real outcome.I began my journey into
AGW skepticism ten years ago (I now am convinced that it is really only a conjecture
with little or no data to support it) I’m afraid most of the damage has been done
politically and vested interests of politicians ,croney capitalists and compliant media
have ensured no wiggle room or turn back now.For most Australians talk of null
hypothesises and empirical data mean nothing except either glazed or rolling eyes
but the media presentation of exaggerated consensus science a lot of staying
power.
I have to agree sadly – lecturing in a science course I saw the curriculum watered down year after year to the point that the students emerging with an Advanced Diploma of Science cannot tell you what pH means.. Truth be told there was almost no science left in the course and comparing the course requirements and outcomes from a mere ten years prior, students passing with their Adv Dip Sci knew less today than the students at intake a decade ago.
But I’d like to bring this to people’s attention (again) – the measured hourly CO2 levels at Utah U. OK it’s just one site, but think – we (in Oz) are blasted with daily UV index data, daily temperature data – why with all the fuss about CO2 being evil are there so few stats on CO2 levels?
Probably because any clod will see what botanists know, plants gobble CO2 as fast as it’s made available when they can get it during the daylight hours. Anyone looking at these CO2 figures would see clearly CO2 rising at night as the plants, microbes and human sources pump CO2 into the air and as soon as the sun comes up the levels plummet sharply and do not begin to rise until night falls again. They would also see summer (warm) periods the CO2 levels drop lower as the more abundant plant life uses it, and in the colder winter months when plants are not growing CO2 levels do not drop as far or far or as fast.
Anyone would also see there’s utterly no correlation between daily CO2 levels and temperature whatsoever. If CO2 was this great heat trapper, one could expect to see a signal in the temperature data (which of course ain’t there). We see temperature correlating with incoming radiation changing with the seasons – but nothing with CO2.
I really think if more believers were shown this site with it’s daily CO2 levels they might finally see clearly just how CO2 works on this planet to keep us all alive
Australia shutdown most of it’s direct Climate Research after Paris except parts that form part of BOM. The major universities and a crowd funding exercise formed the Climate Council and a few other leftist organizations (you loom deep enough you will likely find GreenPeace)
https://www.climatecouncil.org.au/about-us
They basically exist to try and keep the message alive in the media.
Neither major party will be doing much in the space and the Greens dominate a small noise vote of around 7%. The only real change if Labour comes into power will be a price put on carbon for electricity generators but because of the Eastern State Government debacle with gas they are already paying ridiculously high prices. That should ease at about the same time a price mechanism is put in so the change will be next to nothing. The carbon price is bought in at the same time renewable supplies must contain guaranteed 30% baseload capacity so it’s a market levelling mechanism that favours neither source. One could argue what you end up with is 30% baseload and 70% renewable which is the end numbers the grid operator wants.
Nothing else will really change as as we use up our creative accounting credits Australia will fall outside it’s Paris agreement in 2020.
“The lower panel shows that the carbon-dioxide concentration over the same period has been consistently increasing. Neither the cooling trend nor the cyclic behaviour of temperature is reflected in the carbon-dioxide record in the lower panel. Therefore carbon dioxide cannot be causing the observed temperature changes.”
Complete nonsense. The total range of CO2 shown there is from 260ppm to 280ppm. No-one expects change in that range to have significant climate effects. It isa straw man. No-one expects carbon dioxide to be causing those temperature changes.
Yeah, because the effect of CO2 is not logarithmic. /sarc
And of course that is ice core data which disagrees somewhat with plant stomata data.
There is virtually no logarithmic effect in that range of data. And not much in the range from then to date.
Exactly. So what caused the warming?
The temperature increase caused by a change from 260 ppm to 280 should be larger than that by a change from 380 to 400 – or am I missing something?
“from 260 ppm to 280 should be larger”
Yes. one ratio is 1.077, the other is 1.053
1.077 is 22% larger than 1.053.
Nick, 260 obviously didn’t cause cooling……temps were a lot warmer
something else made it warmer besides CO2
Increasing CO2 will cause warming. No-one claims that you can’t have warming caused by something else.
That’s sorta the point Nick……
“Increasing CO2 will cause warming.”
No sign of that happening anywhere , Nick.
Not in any real data.
Not in the satellite temperature data,
Not in sea level rise.
Not anywhere.
No empirical evidence what-so-ever. !
Seen this Nick?
From here for the background,
http://www.c3headlines.com/2009/12/are-modern-temperatures-unprecedented-us-govt-greenland-ice-core-research-finds-theyre-not-even-clos.html
Sunsettommy, didn’t anyone tell you that extrapolating from a single geographic data point is stupid?
For example Sunsettommy, ocean sediment cores from the Caribbean show that ice is impossible in the last 50,000 years.
“No sign of that happening anywhere , Nick.”
Except in the media and in the supporting propaganda (including the propaganda masquerading as ‘science.’) Its everywhere there. The public that still believes this Big Lie do not look any further that that. If Kim Kardashian says it is happening, then it is. Add Bill Nye’s opinion and its positively undeniable!
As the esteemed Canadian charlatan ‘Captain’ Paul Watson once famously said, ‘its not what is true but what people believe is true.’
It will take something big to properly expose the data molesters.
I think Nick means “increasing CO2 should cause warming.”
“I think Nick means “increasing CO2 should cause warming.””
No reason to “believe” that.
Never has before. !
“Increasing CO2 will cause warming.”
We had increasing CO2 from 1940 to 1980, yet the temperatures cooled, they didn’t warm. There goes your theory.
“Seen this Nick?”
Yes. Just another in an interminable series showing Gisp2 data and claiming to show “Modern warming substantially below medi…” when the data ends in 1855.
Nick, badly misunderstood the point of the chart I posted,you said,
” Nick Stokes
November 22, 2017 at 9:26 pm Edit
“Seen this Nick?”
Yes. Just another in an interminable series showing Gisp2 data and claiming to show “Modern warming substantially below medi…” when the data ends in 1855″
You had claimed more CO2 caused warming,the chart shows differently. Have you figured it out now?
Sunset
“Nick, badly misunderstood the point of the chart”
You gave no words to express the point. What you did give was a false and misleading heading, misrepresenting the data.
As to this
“You had claimed more CO2 caused warming,the chart shows differently”
the chart doesn’t show that at all. It does not show more CO2; it shows largely constant CO2. And if you had been paying attention at all, you would have heard me saying that CO2 was not causing temperature variations in this time, if only because it wasn’t itself varying. More correctly, because nothing was driving it.
Your green line looks hand drawn, badly, and is also misleading. The GISP temperature data ends in 1855, well before CO2 began to rise. So no correlation with the CO2 rise driven by fossil fuel burning can be expected there.
Increasing CO2 will cause warming
=======((
the paleo records for the past 400k years show the opposite. temps drop when co2 is highest. temps increase when co2 is lowest.
R Kernodle, the Caribbean marine sediment data and coral records do show a glacial signature over the last 50 k years, it clearly indicates a significant sea level drop and then rise (over the last 18 k years) of more than 125 meters, only a glacial event can produce that large of a variation…
So you are admitting that CO2 was not a significant driver of climate over the last 10,000 years, but suddenly now it is the dominating factor?
Is your premise that there are factors, other than carbon dioxide, that can (and do) significantly influence temperature increases?
What are those factors? At what range are they “stronger” than CO2 & why?
Is it the temperature that has increased the CO2 in the past (the lag), or is it those other significant factors that influence both temp & CO2 increase?
DonM,
“Is your premise that there are factors, other than carbon dioxide, that can (and do) significantly influence temperature increases?”
Is yours that there are not? Yes, basically nothing has been forcing changes in CO2 for millions of years. So CO2 wasn’t forcing temperature change. But there was change, so something else caused it.
Now CO2 is shooting up because we are mining and burning huge amounts of fossil fuel. That has never happened before. It will force warming.
Nick, until you can answer this:
“What are those factors? At what range are they “stronger” than CO2 & why?”
..you can’t answer this
“It will force warming.”
Lat, Nick and Javier had a back and forth similar to the point that you have raised here. It’s not plausable that co2 has much if any impact on temperature in the glacial cycle. Tiny ghg co2 is competing with big ghg water vapor and at just 4-5C warming globally, there is just not enough warming to go around. Nick suggested then that this currently is a one time dumping of co2 unprecedented in (recent) history. Javier responded that since this is a one time event without precedent we really have no idea what it should do temperature wise. (and to suggest that we do is pseudoscience)…
“It will force warming.”
OK, sure Nick, but that is a bit like saying infants will grow as they age.
The only important issues are how much warming and at what rate. The data are infinity more complicated than your comment of “it will force warming”, and the climate models are… ahem… much less than consistent. OTOH, most empirical models are quite consistent with each other: the warming will most likely be modest.
Fortunately, the ongoing experiment of using fossil fuels and evolving technological sophistication to raise humanity from poverty and ignorance to wealth and education will come to a close long before the green rabble, in Australia or elsewhere, gets to impose its wacko green ideas on everyone else. Extreme poverty is falling at a rate which means it will essentially be eliminated within 15 years. Good thing the climate madness has not derailed this progress…. but I must admit that is not for lack of effort among the “climate concerned”.
Fonz,
“Javier responded that since this is a one time event without precedent we really have no idea what it should do temperature wise”
Doesn’t sound like a recommendation! But actually, we do. Arrhenius wasn’t far off.
in 1908 Arrehnius wrote that CO2 induced global warming would improve the climate, green the Earth, and help in propagating mankind. We need more warmists like him these days.
Nick,
“It will force warming.”
It seems you mean something like ~ higher temperatures than would have occurred otherwise, which might actually mean less cooling, should other factors incline temps downward . . such that we are already experiencing about half the additional heating caused by a doubling of preindustrial CO2 levels, right?
Nick: “Yes, basically nothing has been forcing changes in CO2 for millions of years.”
CO2 concentrations have been changing, up and down, throughout Earth’s history. Something caused CO2 to reach concentrations in the past, much larger than today, long before humans were any kind of factor.
Alarmists claim adding a few hundred ppm of CO2 to the meager supply already in the atmosphere will cause a disaster, when it never caused a disaster in the past, even when CO2 was *much* higher than today.
Nick: “Now CO2 is shooting up because we are mining and burning huge amounts of fossil fuel. That has never happened before.”
I don’t know if you are talking about coal mining never having happened before, or whether current-day CO2 levels are unprecedented.
CO2 levels have been much higher in the past than they are today. Claiming current CO2 concentrations or near-future CO2 concentrations are unprecedented is ridiculous, whether humans contribute to the amount or not.
Arrhenius worked in an artificial enclosure in a lab. What he found is of little relevance to a very complex climate system, that after studying for decades we still do not know how it responds to the added CO₂.
Since we can’t get to the answer that way, there are two alternative approaches. One is to look at paleo evidence. Again the data is inconclusive, but not very supportive that CO₂ has been driving climate for the past 125,000 years. Then we have to look at past temperature changes to see if the change we are experiencing is both untimely and unusual. The answer in this case is clearer, natural warming was expected at this time and has been occurring for the past 350 years, so no, the warming is not untimely. And despite some claims to the contrary the evidence is that the warming is not so unusual. Periods showing half of the warming that we have experienced in the last 40 years have a recurrence of about 500 years.
The conclusion is that at worst, 1/3 to 1/2 of the warming is man-made. Then we look at the effects of this warming and the case is dismissed. No damage for the past 350 years. Quite the contrary, a very important improvement of conditions. Humankind is globally at its best period ever. The rest of the biosphere, however, is in pretty bad shape, but it is not climate’s fault. It’s ours. Blaming the climate is the wrong approach.
The only logical conclusion is that whatever future warming is caused by future emissions we most likely can cope with it, and when natural warming changes to natural cooling, it might be good to have some extra CO₂ around.
The 1000-year solar cycle showing our present condition, compared to the Bond series of North Atlantic iceberg activity. Warming was expected according to the cycle, and warming is observed.

Nick, every time i see one of these dopey posts, i think of you (skeptics really shouldn’t need you to rebut such nonsense, but, alas, we do)…
Even if the ipcc’s 3C ECS were true, co2 would only account for a third of the warming in a glacial cycle. That something else must be driving the glacial cycle is well known. And certainly no one expects a mere 2ppm increase per century to be driving any of the variability that is witnessed in greenland or anywhere else for that matter. (even the ipcc admits that early twentieth century warming is not anthropogenic) i like the thrust of the basic argument of this post, though. It would be nice to see it backed up with a little bit more soundness to the science…
The Danish Meteorological Institute’s temperature charts go back to 1959. They show remarkably stable Summer temperatures and substantial Winter warming. Given that solar infuence is minimal, the temperature variation must be linked to atmospheric circulation.
“There is virtually no logarithmic effect in that range of data”
And why is that? Is 260/280 already the long tail of the curve?
“No-one expects carbon dioxide to be causing those temperature changes.”
Do you feel any need to wonder what IS causing those changes?
log(270) = 5.5984
(log(260)+log(280))/2 = 5.5977
The log curve is negligibly diffreent from linear over this range.
Log(1) is zero. Log(2) is .3. Log(3) is .48. The values of the ppm we can measure are arbitrary. They have no absolute meaning in the log curve, which is itself merely an empirical approximation of “saturation”. The point is that in an approximately logarithmic diminution of effect with increasing concentration, where you fall on the curve matters. If 180ppm=zero, you expect to see change from 260 to 280 (80 to 100). If 180ppm=1000, you do not.
“The log curve is negligibly diffreent (SIC) from linear over this range.”
Which means that the temperature can’t have changed under the current CO2 drives global temperature theory. So if there was no noticable change in CO2 forcing, why did the temperature change? It is disproof by “Reductio Ad Absurdum”.
“The problem is that between 6000-600BP, CO₂ was increasing and planetary temperatures were decreasing. According to models temperatures should have increased. It is known as the Holocene temperature conundrum.”
No “conundrum” to me – solar TSI at 65 deg N decreased by something like 20 W/m2 during that period.
http://68.media.tumblr.com/28974d49429ae9a8b92bd60c1c69b1ed/tumblr_omviowAc481t4esr2o1_1280.jpg
If you can’t extrapolate temperature from a single point in Greenland…65N is not the latitude capital of the planet either. Just south of the Arctic Circle, which is defined as the line of zero weak sun at Christmas and endless weak sun the Fourth of July, 65N gets an average of 100 W/m2 of surface insolation. The tropic of
Cancer (23.5N) gets 300W/m2 surface insolation.
I know, I know…the 65N transect, cherry picked to include Iceland and the narrowest part of the Bering Strait, has a lot more land than ocean. So what? Land insolation does not drive planetary temperature, ocean insolation does. Does it matter when the land is covered with ice?
Contrary to popular belief, the best fit to obliquity in the longer running Vostok cores is not 65N, but the sum of 65N and 65S, with an r sq of .31.
Obliquity is clearly an influence, but it does not control.
Obviously climate models already “know” and take that into account, so yes “conundrum” to everybody but you.
Come on, Nick. The point is about correlation between temperature change and CO2 concentrations. There isn’t any. It doesn’t matter that CO2 did not change. The temperature did, and there was no correlation. Are you saying the argument is only valid if CO2 is also changing? Fine. Take a look at the previous billion years. when temperature and CO2 were changing dramatically. See any correlation there? No. Are you trying to argue that for the first time in the history of the Earth, CO2 is suddenly the primary driver of global air temperature?
jc, i think nick does argue that. Because this is a one time dumping of anthro co2, we should expect warming. (that’s his opinion and i suppose he’s entitled to it)…
+1
“that’s his opinion and i suppose he’s entitled to it”
However wrong the theory, and however much the actual evidence disproves it, he is entitled to his opinion.
So anthro molecules consisting of one carbon and 2 oxygen atoms are different that non-anthro carbon molecule consisting of one carbon and 2 oxygen atoms, and that difference turns a CO2 molecule into a super climate regulator? Nature has dumped a lot more carbon into the atmosphere than humans ever will, and there has never been a correlation between significant changes in the CO2 concentration and temperature, according to our best evidence.
If, however, you graduated from the Judy Tenuta School of Science, I guess….
(that’s his opinion and i suppose he’s entitled to it)…
=========
opinion is not science. it isn’t even fact. it is belief.
there have been large volcanic eruption over thousands of years that released massive amounts of co2. well in excess of anything possible if all fossil fuels were burned. these events are never out forward in su0port of ghg theory.
The problem is that between 6000-600BP, CO₂ was increasing and planetary temperatures were decreasing. According to models temperatures should have increased. It is known as the Holocene temperature conundrum.
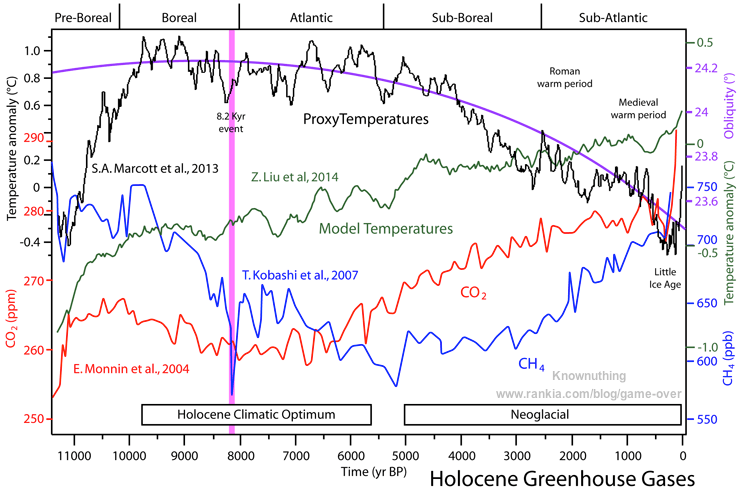
Figure 38. Temperature and greenhouse gases changes during the Holocene. Black curve, global temperature reconstruction by Marcott et al., 2013, as in figure 37. Purple curve, Earth’s axis obliquity cycle. Red curve, CO₂ levels as measured in Epica Dome C (Antarctica) ice core, reported in Monnin et al., 2004. Blue curve, methane levels as measured in GISP2 (Greenland) ice core from Kobashi et al., 2007. Notice the great effect of the 8.2 kyr event on methane concentrations. Green curve, simulated global temperatures from an ensemble of three models (CCSM3, FAMOUS, and LOVECLIM) from Liu et al., 2014, show the inability of general climate models to replicate the Holocene general temperature downward trend. Pink bar, 8.2 kyr BP climatic event. Major Holocene climatic periods are indicated.
https://judithcurry.com/2017/04/30/nature-unbound-iii-holocene-climate-variability-part-a/
Clearly the climate sensitivity to CO₂ in models is excessive. The article is correct in that the data does not support an alarmed view of Modern Global Warming.
“The problem is that between 6000-600BP, CO₂ was increasing”
260 to 280 ppm is about 1/10 doubling. So temperature might be expected to increase by about 0.3°C. The Z Liu model seems to show quite a lot more than that. Maybe it is more sensitive, or maybe the cause is something else. The think is, it’s a small amount, and competing with the obliquity effect. A natural suggestion is that the Liu models did not properly account for obliquity. Another possibility is that the small change in CO2 is within measurement noise.
It is not if you believe Marcott et al., 2013. According to them the entire change from the top of the Holocene Climatic Optimum to the bottom of the LIA was only 0.7°C, so the CO₂ presumed change is very significant at that temperature ranges. The whole of the Ruddiman hypothesis is based on our problem to understand the Holocene in terms of the modern GHG hypothesis.
And if you go to deglaciation, then CO₂ change was 1/3 of a doubling and the temperature change was 4-5°C. Big trouble in paradise because for 1/3 of a doubling we have observed 0.8°C, and part of it no doubt natural warming from coming from the LIA.
There is a huge problem addressing past CO₂-temperature relationships using present estimates of climate sensitivity. There is absolutely no problem if we assume a low sensitivity value.
Yes, I think there is a key word in the article that even allows for some ‘wiggle’ room, and is a bit of a weasel word the way it is phrased. “the question of whether carbon dioxide is causing ‘dangerous’ global warming.”
It sort of implies there is some small CO2 warming, but it is not dangerous. And I would agree with that. Warming has always been better for life than cooling. Should go without saying.
It is probable that the sensitivity of CO2 is fairly small, maybe even smaller if the 2nd and 3rd feedback orders are indeed negative. But it is also probable that the basic physics of CO2 warming is ‘baked’ into the present temperature and record, but is definitely not the driving force, and indeed, we will never probably know because we never started off in 1850 with a double blind study i.e. a second planet Earth that stayed static which we were able to measure and compare with today’s Earth. Everything changes everything, especially going forward, but I believe in 30-40 years, we will have some very accurate knowledge of what is causing what, and CO2 will have turned out to be mainly positive for human kind.
I agree…….. because there is no “800 year CO2 lagging the temperature rise” in the 2-panel graph.
In an early comment on a slightly different topic I said from my years or experience dealing with government scientists and the news media both seldom if every would admit that they were wrong. That is not true of politicians. If pressured enough by the electorate they will change their opinion. That is both good news and bad news because if the generally electorate doesn’t understand an issue or the truth they can push the politician into doing really dumb policy. Our problem today is people want to believe that computers and therefore computer models are all powerful, maybe if not today but soon smarter than humans. Of course the other problem set forth in the above essay is that our government bureaucracies and our educational system are dominated by the political left. They have made AGW a so called “social justice” issue.
A superb article, realistic, founded on best available data with a clear understanding of the data limitations, far removed from Mickey Mouse modelling and source data fiddles! Truth will out
Why not?
Because carbon dioxide hardly changed.
because it was warmer when CO2 was lower
Why are the two Y axes scales on the top graph so different. Aren’t they supposed to be the same (sort of) thing, ie temperature?
The left is 0.8 C, and the right is 3.0 C!
I’m with Nick Stokes on this one.
OK, I take it back. My eyesight is poor.
Left is 8 C right is 3C?
I still think its comparing apples and cheesecake. The scales are silly and the locations are silly (Greenland summits and global temps).
“The current meteorological record shows that there has been no statistically significant warming over the past 19 years. “
To see what nonsense this is, you only need to read Werner Brozek’s posts, of which this is the latest. Surface records show significant rise in the last five years. Satellite records struggle to reach significance because of their greater variability, but the actual trends are high. Over that 19 years, UAH V6 TLT rose at 1.34°C/cen, RSS V4 by 1.94°C/cen.
Nick, that is nonsense. Looks like you are cherry picking again. I can do that too. From mid 1997 (prior to El Nino effects) until mid 2017 ( a full 20 years) we have a trend of less than .6 C/century. This will only come down as we move into La Nina over the next 6 months.
http://www.woodfortrees.org/plot/uah6/from:1997.5/to:2017.5/plot/uah6/from:1997.5/to:2017.5/trend/plot/esrl-co2/from:1997.5/to/normalise/offset:0.5
RSS V4 is no longer true satellite data and hence worthless.
“No causation can exist if there is no correlation.”
Not if you’re willfully looking through the wrong end of the telescope.
I didn’t realize how cold it really was outside….
Hey, why don’t we make a graph that shows the CO2 anomoly, with respect to the temperature instead of the temp anomoly with respect to co2 concentration.
And finally, this post won’t make any sense for another 700 years or so … that’s called lag time.
No. Makes perfect sense Don.
You didn’t realize it was an anomaly.
Um, the graph would look the same actually.
And finally you don’t say whether you agree with OP saying there is no correllation.
@tony
Are you repeating the Al Gore fallacy, zooming the graph out far enough to hide the fact that CO2 LAGS temperature? The previous comment was incorrect, there is of course a correlation, but it’s not as you think. Please explain to me how CO2 can lag behind temperature by several hundred years and still be the driver of temperature.
WR
“The previous comment was incorrect, there is of course a correlation, but it’s not as you think.”
Really?
So I got it right but I’m still wrong. Please do tell me what I think.
tony mcleod,
All what the graph shows is that there is a correlation between temperature and CO2 over large periods. That doesn’t tell you what cause is and what effect. In this case, there is a clear lag of 800 +/- 600 years of CO2 after upgoing temperatures and several thousands of years in the opposite direction.
The latter is interesting: after the previous interglacial, the Eemian, CO2 remained high, while temperature cooled down to a new minimum and ice sheets increased to a new maximum. When these were reached, CO2 levels dropped with about 40 ppmv, without much influence on temperature or ice sheet formation (even warming and melting…):
http://www.ferdinand-engelbeen.be/klimaat/klim_img/eemian.gif
Where delta Ts is the “corrected” temperature (from the proxy d18O in ice) according to Jouzel en d18Oatm is measured from N2O in the gas phase as a reverse proxy for ice sheet formation, here already reversed and scaled to show ice sheet changes.
All we can say from this detailed graph is that the bulk of the correlation is from temperature as cause and CO2 as effect and that the reverse effect is drowned in the natural variability, thus certainly not huge…
You can not project the CO2 concentration until the year 2050 because no one knows how the concentration will be. The earth reacts to rising CO2 by greening with a delay and absorbs more CO2 accordingly. This will make the curve flatter over time and possibly reverse the trend.
Peak CO2 was NEVER able to maintain peak temperature.
In Fact Peak CO2 was followed DIRECTLY by rapid cooling
End of story. !!!
We can be very thankful for the HIGHLY BENEFICIAL rise in atmospheric CO2 as it allows us to feed the world’s increasing population.
Certainly there is absolutely NO SIGN of CO2 causing warming anywhere except in unvalidated models.
+1
Tony, I disagree. Your graph does not offer evidence that CO2 drives temperature. I am convinced that increases in CO2 level do cause warming, but your 450K year graph does not show that.
The problem with examining such long time scales is that other factors come into play which we can reasonably neglect over the time period which Ian examined, but which it is unreasonable to ignore over the time period in your graph.
One possible such factor is the common assumption of a constant “solar constant.” That assumption becomes more and more questionable the further back in time you go.
But by far the most obvious and important of those factors which you should not ignore are the Milankovitch-driven glaciation/deglaciation cycles. That’s not much of an issue in Ian’s Figure 1 (except near the left end), because the Laurentide was gone by 8K years ago. But it is certainly the dominate factor creating the correlation shown in your 450K year graph.
The Milankovitch cycles operate as the control knob which drives the Earth’s glaciation/deglaciation cycles, by varying the range of seasonal changes:
When the Earth’s orbital obliquity is high, the seasonal changes are large: summers are hotter, and winters are colder. That causes the great northern hemisphere ice sheets to retreat, because hotter summers melt ice faster, and because colder winters produce less snowfall. The combination of those two effects causes the ice sheets to loose mass, and retreat.
OTOH, when the Earth’s orbital obliquity is low, the seasonal changes are smaller. The summers are cooler and the winters are warmer. So the ice melts less in the summer, and the snow accumulates faster in the winter. Those two factors cause the ice sheets to gain mass, and advance.
Those glaciation cycles are part of a slow “integral feedback” system, which causes large albedo changes in the Earth, and greatly affect both the temperature and CO2 level. But, despite Al Gore’s infamously deceptive presentation implying otherwise, the correlation is not evidence for CO2 driving temperatures.
And that if you’re looking for a cause, a strong correllation is a good place to start.
Tony wrote, “And that if you’re looking for a cause, a strong correllation is a good place to start.”
Not in this case. Ian was talking about whether CO2 drives temperature. You and Al Gore used a graph which is completely irrelevant to that question.
Tony>”And that if you’re looking for a cause, a strong correllation is a good place to start.”
well, the graph you posted ain’t it…..
WR asked you a question….you dodged it
WR
November 22, 2017 at 8:58 pm
@tony
Please explain to me how CO2 can lag behind temperature by several hundred years and still be the driver of temperature.
“@tony
Please explain to me how CO2 can lag behind temperature by several hundred years and still be the driver of temperature.”
I don’t know why this seems to be difficut to understand…
Increasing CO2 will raise global temp whether it comes first or second (even by hundreds of years).
It’s driving now because of humans.
If a +ve feedback due orbital eccentricities (as pre-industrial) it is still going to up temps.
And then more WV (CO2 is non-condensing) can be evap into the atmosphere with further +ve feedback.
The long time-scale is a function of having 2 contrasting hemispheres.
NH mainly land and/or ice >>> most sensitive to TSI.
SH mainy Ocean >>>> least sensitive.
What connects?
Ocean circulation which takes ~ 1000 years to cycle.
ah…so raising temps will raise CO2 levels (second)
…then what stops run away global warming?
@ur momisugly Toneb – November 23, 2017 at 6:39 am
Iffen global increases in CO2 ppm raises global temperatures, …… then surely local increases in CO2 ppm raises local temperatures.
So Toneb, ….. please cite a reference to a scientific study/paper that is proof positive that local increases in CO2 directly causes increases in local temperature.
Iffen your claim has any truth to it, …….. then greenhouses that are maintained at 800 to 1,000+ ppm of CO2 to improve plant growth, ……. should maintain higher temperatures than non-maintained greenhouses that have 400+- ppm of CO2.
You can beg, borrow, buy or steal a thermometer, ……. so go check the truth of your claim.
Awesome! Thank humanity for all those CO2 riches, which will rescue C3 plants from starvation.
Mankind to the rescue of the biosphere! I’m so proud to be one and do all I can to increase my CO2 footprint, even if that means drinking more beer and champagne.
For the plants, I’m all in.
+100
DaveBurton
“Your graph does not offer evidence that CO2 drives temperature.”
I made no such claim, even though it is true say CO2, amongst other things drives temperature. I was merely pointing out that at least over this sort of time interval CO2 and temperature are very well correllated.
That temperature seems to drive CO2 does not mean that CO2 can’t drive temperature.
Tony, since Ian’s argument was about whether CO2 drives temperature, and you were arguing with him, saying now that you “made no such claim” seems a weak defense. He was obviously talking about the fact that there’s no correlation between them which is consistent with those CO2 level changes driving temperature changes to a significant extent. I don’t think you were just being pedantic about the slight imprecision of his language.
I agree, however, that the fact that temperature can affect CO2 level doesn’t meant that CO2 level can’t drive temperature. In fact both are true, which is why it is a (weak) positive feedback mechanism.
Peak CO2 was NEVER able to maintain peak temperature.
In Fact Peak CO2 was followed DIRECTLY by rapid cooling
The graph shows absolutely ZERO possibility that CO2 drives temperature in any way what-so-ever.
End of story. !!!
We can be very thankful for the HIGHLY BENEFICIAL rise in atmospheric CO2 as it allows us to feed the world’s increasing population.
Certainly there is absolutely NO SIGN of CO2 causing warming anywhere except in unvalidated models.
“I agree, however, that the fact that temperature can affect CO2 level doesn’t meant that CO2 level can’t drive temperature. In fact both are true, which is why it is a (weak) positive feedback mechanism.”
Me too.
daveburton
In a complex chaotic system positive feedback tends to lead to regular monotonic oscillation.
The fact that climate does not show this (otherwise it would be no more unpredictable than the rising and falling tides), but instead shows a Lorenzian random walk like path, this by itself makes it clear that there are significant negative feedbacks in the system.
The parts of the climate system that contain positive feedback are marked as such by signature oscillations. Such as ENSO (the Bjerknes feedback) and the AMO (the AMOC salinity-downwelling-Greenland ice melt feedback).
@ur momisugly daveburton
“YUP”, and in fact it is also true that there is a Flying Spaghetti Monster.
Asa matter of fact, …… I have seen the FSM just as many times as you have seen CO2 causing an increase in atmospheric temperatures.
ptolemy2 wrote, “In a complex chaotic system positive feedback tends to lead to regular monotonic oscillation…”
Strong feedbacks with time delays can certainly cause oscillations (I guess by “monotonic” you mean of fairly constant frequency?), but that’s true for both positive and negative feedbacks. Weak feedbacks, either positive or negative, don’t cause oscillations, except that integral† feedback (like ice sheet advance/retreat / albedo!) tens to cause such instability.
The Earth’s climate system has many feedback mechanisms, both positive and negative. Climate alarmists (at least the ones who even understand what feedbacks are) believe that the positive (amplifying) feedbacks are much larger than the negative (attenuating) feedbacks, but I find scant evidence of that.
† That’s “integral” in the mathematical sense, the opposite of derivative.
s/tens/tends/
Your graph actually doesn’t support causality of temperatures by CO₂. The current change of temperature is indistinguishable in the lower (red) graph.
Tony McLeod
Welcher on bets
Tony McLeod
You have proven to be a dishonest person why should anyone listen to you about anything
Dude, your purported grossly abnormal current CO2 level falls in the Pliocene at Cenozoic scale.

Above is arguably our best synopsis of planetary Cenozoic temperature.
Who is looking through the wrong end of the telescope?
I concur Dr Ian Flanigan. But I fear Australia is already lost. The damage is already done with your electricity prices having risen so astronomically high within a few years, but yet you are the largest exporter of LNG in the world. And then they blow up a perfectly good coal fired plant in SA, that could have been a back-up for emergencies. Sometimes you just can’t fix stupid. Sorry, but good luck. All the Best!
There is far too much taxation (revenue) for the govt in Global warming BS for them to admit their error and change. Only a taxation revolt – ie smash solar panels (govt taxation devices) will result in change.
Don’t smash the solar panels…just whitewash them white so they reflect all that sunlight! That will cool everyone down. And when everyone comes to their senses after the civil war (election), they could maybe do some sensibly thinking how Australia could incorporate its own clean natural gas into its power mix, so that all of industry doesn’t up and leave Oz. Because that is what is starting to happen as we speak.
I think it is rather ironic that they have a govt in Australia right now which thinks it is listening to the right people on climate (the warmist/alarmists) when Victoria state recently had a frost that killed up to $180 million worth of crops. If the Earth is in fact going to start cooling in the years ahead as some are suggesting, perhaps this is something they should consider getting used to……
“…..Agriculture Victoria’s southwest grains regional manager Rob O’Shannessy estimated farmer losses from the frosts at $100-$180 million. This included frost damage this month, as well as earlier, smaller frosts in the North East and northern Wimmera…..”.
http://www.weeklytimesnow.com.au/agribusiness/cropping/harvest-cold-snap-wipes-out-180m-worth-of-victorian-crops/news-story/d558362a36ebb3e187b2aab95edd10f8.
Yes. It surprises some politicians that we continue to have cold weather. I suspect they thought most people wouldn’t mind if they jacked up power prices because in a warmer world they wouldn’t need as much heating.
Hypothesis: Most the the reported warming in the surface data sers are synthetic, made up by adjustment.”
And the “adjustments” in almost in perfect accord with CO2 rise. !!
Its almost like it was PLANNED by some mindless, irrational AGENDA of some sort.
It’s about time that some real evidence was offered to the general public to dispute the consensus that temperature rise is caused solely by carbon dioxide rise, clearly it is not.
Go for it. I’d like to see real evidence too. Since I’m not getting any from this article.
That isn’t the consensus.
In plain blunt English, it is. You can dress up the idea in all kinds of silly “differences”, but bottom line, it is CO2 exclusively that is the problem. Probably because it’s the only one we can control, but that’s another issue.
What do you figure the natural/human consensus ratio to be?
I would like to compare the Ice Cores from Greenland vs Ice Cores from Antarctica, to see if there is much of a difference over the same years…
Best scientific method explanation ever.
I agree with this: “The lower panel shows that the carbon-dioxide concentration over the same period has been consistently increasing. Neither the cooling trend nor the cyclic behaviour of temperature is reflected in the carbon-dioxide record in the lower panel. Therefore carbon dioxide cannot be causing the observed temperature [proxy] changes. No causation can exist if there is no correlation.”
I also agree with this: “The data show that there is nothing unusual about the current episode of increased global temperature in either its timing or its amplitude, which lies well within the bounds of natural variation.”
I would also agree with this, if it were clarified to refer specifically to time period shown in the graph, or to “pre-industrial” levels: “These data clearly show that whatever effect carbon dioxide may have on the temperature, it is far outweighed by other factors:…”
But I do not agree with this: “…and this falsifies the hypothesis that carbon dioxide causes dangerous global warming.”
I agree that the overwhelming weight of evidence indicates that anthropogenic CO2 does not cause “dangerous” global warming, but the graphs in figure 1 do not prove that. The fact that a 7% increase in CO2 level (from 260 ppmv to 280 ppmv) did not cause detectable warming in the Greenland ice core proxy data does not tell us much about the effect of a 45% (current) or 100% to 130% (possible total eventual) increase in CO2 level.
The fact that the warming effect of a 7% increase in CO was “outweighed by natural factors” does not prove that a 45% or 130% change has been or would be.
History has certainly proven that the warming effect of a 45% increase in CO2 is modest and benign, and the best evidence is that an additional 38% to 60% possible increase (relative to current level) would also be modest and benign. But figure 1 doesn’t prove it.
Note on the numbers:
A 45% increase (280 → 406 ppmv) followed by a 38% increase = a 100% increase: 280 → 560 ppmv
A 45% increase (280 → 406 ppmv) followed by a 60% increase = a 132% increase: 280 → 650 ppmv
The totalitarian left seem to have a curious agenda. Rather than actually get elected they decided instead to spend the decade or so of the Howard government inflitrating the science academies and trying to bring about the downfall of Australia by a slow but steady rise in electricity prices. Surely it would have made more sense to actually get elected and actually enact some left wing policies. The success of the left wing agenda in Australia can be clearly seen in our inhuman and illegal treatment of refugees which makes Australia a haven for racists and a disgrace to the civilised world.
This article is yet another example of fundamentally flawed logic with clever spin.
Are you going for a comment that is fundamentally flawed with clever spin, or were there specifics?
If you want to show lack of correlation between CO2 and rising temperature in modern times, just go ahead and leave the last 50 or 100 years off the CO2 graph, as was done here. Maybe WUWT readers will not notice.
Or maybe they will realize that using proxies and breeding instrumental readings to them is scientifically improper.
Oh yeah, and the glaciers are melting, and the weather is really WEIRD, and my house burned down, and all these hurricanes…ignorance and superstition. The superstitious implication is that this is unique and never happened before. The data say the superstition is wrong on all counts.
Funny that the plot was presented at the Heartland Institute in 2015 but shows a maximum CO2 value of 280 ppm. No one in that audience cared that 2015 was the year levels actually topped 400 pmm. And no one here now cares that they are looking at the same deceptive regurgitated trash 2 years later.
it’s not even one whole degree……be afraid, very afraid
Nick Stokes.
You have presented an argument / line of reasoning which I have not seen before. I think you are saying because mankind has only recently added large amounts of CO2 to the atmosphere this recent change WILL force warming BUT because past changes in CO2 were due to natural variability or other unknown factors and nothing to do with man the climate then was not forced by CO2.
As a “guess” as to how things works (I am remembering Feynman’s lectures) this a PERFECTLY VALID idea and I don’t think it has been properly addressed as such on here (yet).
IF anthropogenic changes recently are forcing warming then we need to address 2 relevant questions to follow up your perfectly valid guess;
1. What is the actual mechanism (scientific explanation for what is going on in the atmosphere) by which anthropogenic CO2 forces warming?
2. Why would the explanation for 1. NOT apply to an atmosphere pre industrial revolution which contains the same, or a higher amount of CO2 as that we have now?
The basic thought being that the atmosphere works on physical principles which have no knowledge of the source of the CO2 molecules or how many people live on the planet. CO2 is dumb & the atmosphere works in a physically defined manner (fairly complicated in some respects, simple in others). Can a valid answer to 1. and 2. above be reconciled with this?
I invite Nick to give us his answers to the 2 specific questions above for futher consideration of his new (to me) argument.
Reverend,
It’s the argument I usually present in these circumstances. To visualise, suppose you have a car with a kind of accelerator that stays fixed unless changed. The car is going along a hilly road with no accelerator change. There are speed variations uncorrelated with the fuel supply, which is fixed. Then the driver gradually increases the fuel supply. The car accelerates on average, but still has speed variations due to topography. The prior speed variations with no change of accelerator do not refute the ability of the accelerator to accelerate, if pressed.
As to your questions
1. is just the greenhouse effect – surely no need to rehash here
2. yes, more CO2 for any reason would cause warming. But there was no recent nett source (no new carbon entering) before mining. And present levels of CO2 are higher than any in the last million years, and we have only burnt a small fraction of he carbon that we could.
It’s true that it you go back further, you could find times with higher CO2 and not necessarily much higher temperature. That’s just a longer term version of those hills. Continents move, solar varies etc. It’s also true that in the long term there are sources. Volcanism is a weak source compared with our emissions, but is ciumulative. And exposure of eroding basic rocks is a longterm sink. Both can vary. But AGW is on a much shorter timescale.
I had a 1300 cc Honda, no matter how much harder you pressed the peddle it would only go so fast up hill.
Nick may have been doing the three cup trick, by saying higher CO2 leads to warming….. but…..All things being equal, a bottle filled with CO2 will always warm faster and to a higher temperature when heated than does a bottle filled with regular air because the specific heat of CO2 is lower than that of air. Consequently, less energy is needed to to raise one gram of CO2 one °C than one gram of air one °C. Ergo, this experiment demonstrates nothing more than the principle of physics called “specific heat”. It does not confirm the notion that CO2 at 0.04% of the atmosphere is causing global warming via a “greenhouse effect”. Just as an aside, the effect of doubling the current concentration of CO2 on the specific heat of air would be miniscule; it would decrease it by 0.0002……or there abouts according to others wiser than I. .
Nick, that argument so bad…….but I see why you like it
The car is on a flat road….the acceleration goes up and down…..what makes the acceleration go up and down?
“The car is on a flat road….the acceleration goes up and down…..what makes the acceleration go up and down?”
If a constant throttle on a flat road nothing does.
But he said hilly road which (read natural variation in climate) will give speed variations at constant throttle.
Up the throttle and speed will increase overall BUT there will still be speed variations.
That is more CO2 and the overall temp will rise but there will still be natural variation going on.
“The prior speed variations with no change of accelerator do not refute the ability of the accelerator to accelerate, if pressed”.
Nick, that is a a nice analogy but it far oversimplifies the question. We cannot look to the past and discern narural variability as a series of clearly identified hills because much of the cause of past variablity is unknown. We also cannot claim that we are now on a flat road because natural variablity has not ceased. Finally, we cannot claim that CO2 is the only accelerator and that it has not changed in the past.
A better analogy is Willy Wonka’s elevator. It is filled with hundreds of buttons. Some of the buttons have a known influence and some of the buttons are known, or at least thought, to have no influence at all. There are buttons whose affect varies according to which other buttons are pushed at the same time. There are also buttons that we have no idea what they do, if they do anything at all.
And then there are the Oompa Loompa. How many Oompa Loompa can fit in an elevator is anyone’s guess, even Willy himself doesn’t know, but the elevator is full and they are pushing and holding buttons all the time.
The elevator has been rising and falling and we have a rough idea of some of the button pushes that took place but, we still cannot explain all, or even most, of the cause for past elevator movement.
Of course, there is the ‘red’ button, CO2. There are times when the elevator rose while the red button was pushed but also times when it fell.
The Oompa Loompa are still pushing buttons and now, for the first time in a while, one of them is pushing the red button. Can we say with certaintly that the red button is now the sole cause of the elevator rising?
Toneb ……stupidest most misleading analogy I’ve ever heard
might as well bring up tobacco……again
No one knows if it’s the hills, valleys, or accelerator
Rev, i don’t know just how mainstream nick’s view is… The mosher’s of the world are of the belief that natural variations of co2 also cause warming. (specifically the warming from glacial to interglacial) This is obviously not the case as co2 is only a small slice of the glacial warming pie, water vapor accounting for most all of the ghg warming in that pie. So nick’s position seems to be a wise one. The only real difference between the natural emissions during the glacial cycle and current anthro emissions would be the time factor. It’s one thing for co2 to be rising at a rate of 1ppm per century, and quite another for it to be rising at 100ppm per century. As far as i know, that’s the only difference that nick’s got. It’s a compelling argument, one wonders just how true it is. Like yourself, this is recently new to me. (although i do know it’s been floating around out there, just haven’t paid much attention to it) It would be interesting to see some solid mainstream science to back up the claim…
The key debate is whether human caused atmospheric CO₂ increase is responsible for most of the observed warming or not. A majority of scientists believes it is, but they lack the data to prove it. Without the evidence to prove it, taking far-reaching decisions about our energy policy is a temerity.
Additionally it is clear that the world’s ruling elite doesn’t believe there is a clear and present danger from the increase in CO₂, as they are not taking serious measures to tackle that specific “problem.” What they are doing is pushing an energy transition with public money that is largely irrelevant to the CO₂ “problem” as it affects only electricity and is essentially parasitic of fossil fuels that are still required to produce, install, maintain, and replace the energy generators. And fossil fuels are also required to address their intermittent nature. The evidence for the position of the ruling elite, is that year after year they get together and decide nothing despite constantly rising CO₂ levels. If a big asteroid was to hit the Earth in 2100 they would be pulling together all the Earth resources to try to solve the situation. If CO₂ was really the problem we are constantly told we would all change to nuclear in 20 years and start electrifying the transport right now. People are very aware of this dissonance between what we are told and what the world’s ruling elite is doing. That’s why even a great majority of people that believe the CO₂ is warming the Earth, doesn’t care about it and doesn’t do anything about it. They are going to be very angry when electricity becomes both more expensive and less reliable.
Agreed. If someone TRULY believes in AGW, they cut their carbon footprint, DO NOT fly all over the globe holding conferences and demand money be sent to their governments. I see no cutting of CO2 usage by these “believers”, so I must conclude the belief is just smoke and mirrors hiding a different agenda. When Al Gore, Obama and all the preachers of AGW move into tiny houses with renewable energy ONLY, then maybe I’ll think about considering this a real problem, not a smoke screen.
+100
Very incisive. Javier, I see your writings as the clearest (and data drive) lights in the tunnel. Keep shining on the path.
Happy TG. FYI. The Little Ice Age was from about mid 1500 to mid 1800s. ( when Texas Republic was being formed a huge norther came down and Galveston Bay froze solid!)
The Aussies have had terrific grid crashes with lengthy power outages due to overestimating what renewables can do, hence this article.
Sent from my iPhone
On this graph of Phanerozoic temperature anomaly with atmospheric CO2, can someone please tell me where the “tipping point” is for bad stuff to start happening?
I would say that this tipping point is at the low end around 200 ppm. Except it is BELOW that level, not above it, where the bad stuff starts (CO2 starvation).
So yes we are close to the tipping point of atmospheric CO2. Fortunately, we are moving in the right direction, away from it.
Sorry – I forgot to post the figure:
https://drive.google.com/file/d/0B_RXGJAF_XL5V0Y0eU1ya3E2UTA/view